The figure shows a model of a small room, with the ceiling removed. It is based on a 6m x 4m x 2.5m cuboid, with the extra features of a rounded corner, a cupboard, a fireplace and a window.
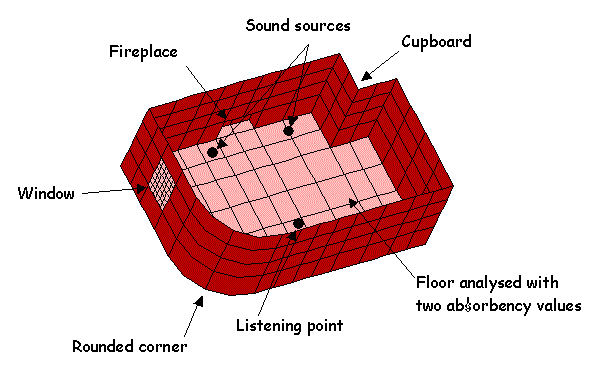
The boundaries are assumed to be rigid, apart from the window made of glass and the floor which has been analysed with two admittance values, representing two types of flooring.
The air is modelled with an acoustic boundary element mesh, composed of quadratic patches.
The window was modelled with structural shell elements which are analysed as fully coupled to the fluid (air) elements.
The frequency range analysed was from 10Hz. to 150Hz in 0.5Hz steps.
Graph of Sound Pressure Level (SPL) at the listening position against frequency
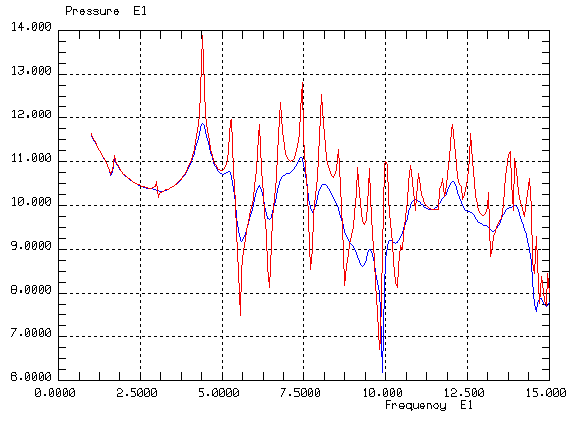
 High absorbency
 Low absorbency
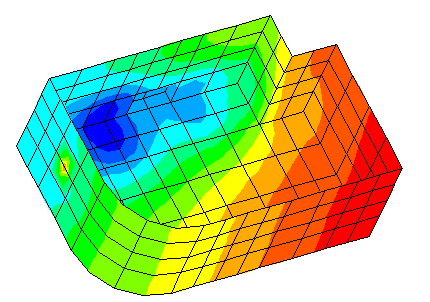
From the graphs it can be seen that in both the high and low floor aborbency analyses the first resonant frequency occurs at approximately 17Hz, which is the first resonant frequency of the window.
Pressure amplitude contours at 17Hz. for the higher absorbency analysis
 Shaded contours |
 Animated contours |
 Deformed shape |
 Animated deformation |
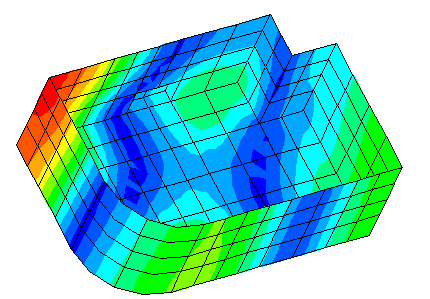
From the graphs it can be seen that in both the high and low floor aborbency analyses there is a resonant frequency at approximately 52Hz. Note, the 1,1,0 mode of a 6m x 4m x 2.5m cuboid room is 51.79Hz.
Pressure amplitude contours at 52Hz. for the higher absorbency analysis
 Shaded contours |
 Animated contours |
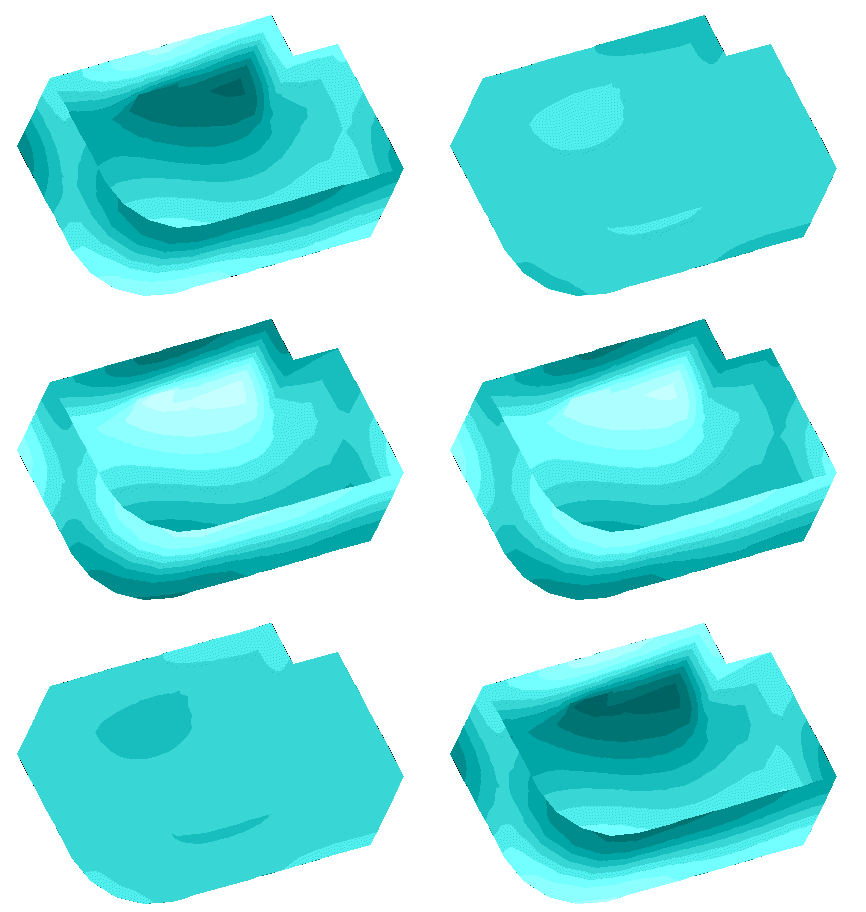
The graphs also indicate a resonant frequency at approximately 81Hz, in both the high and low floor absorbency analyses. Note, the 0,1,1 mode of a 6m x 4m x 2.5m cuboid room is 80.19Hz.
Pressure amplitude contours at 81Hz. for the higher absorbency analysis
 Shaded contours |
 Animated contours |